
When discussing investing, especially for retirement, it makes sense for the core of that investment to be held in equities (stocks). Equities provide a long time horizon, even longer than bonds, which is part of why we are compensated for holding them. The long term geometric average return to Large Cap equities (think S&P 500) is ~ 10.5%, while the return to Long Term Govt Bonds is ~ 5.5%. This means the long run backwards looking market risk premium to equities is ~ 5%. The common question we run into when planning for retirement is how much should I hold in stocks, given my time horizon?
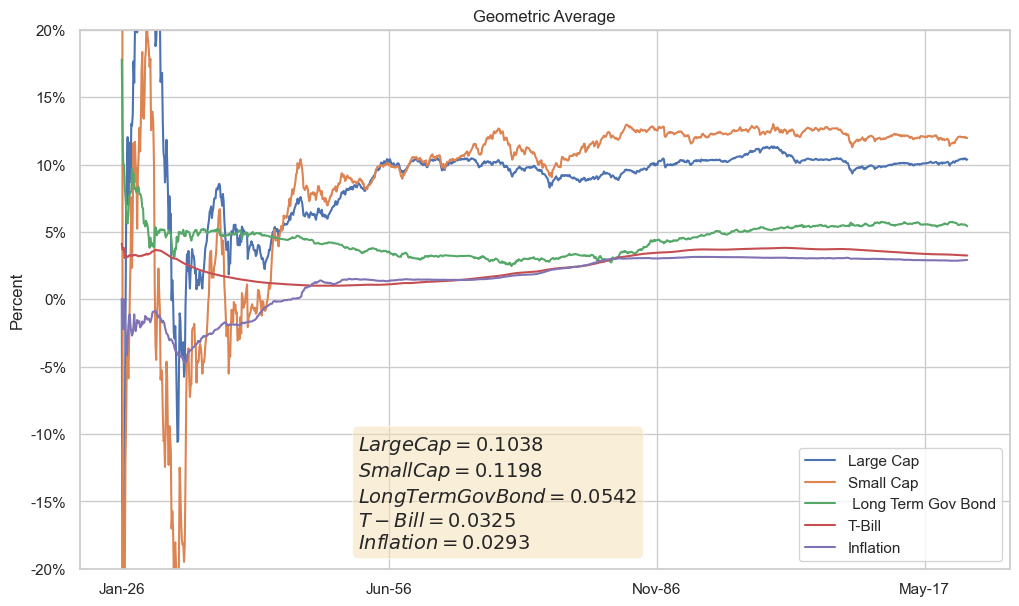
Well, judging by the chart above, clearly if you had an infinite horizon it would be 100% equities all the way! For the mere mortal, we need to decide when and how much we invest in equities, compared to other investments such as bonds.
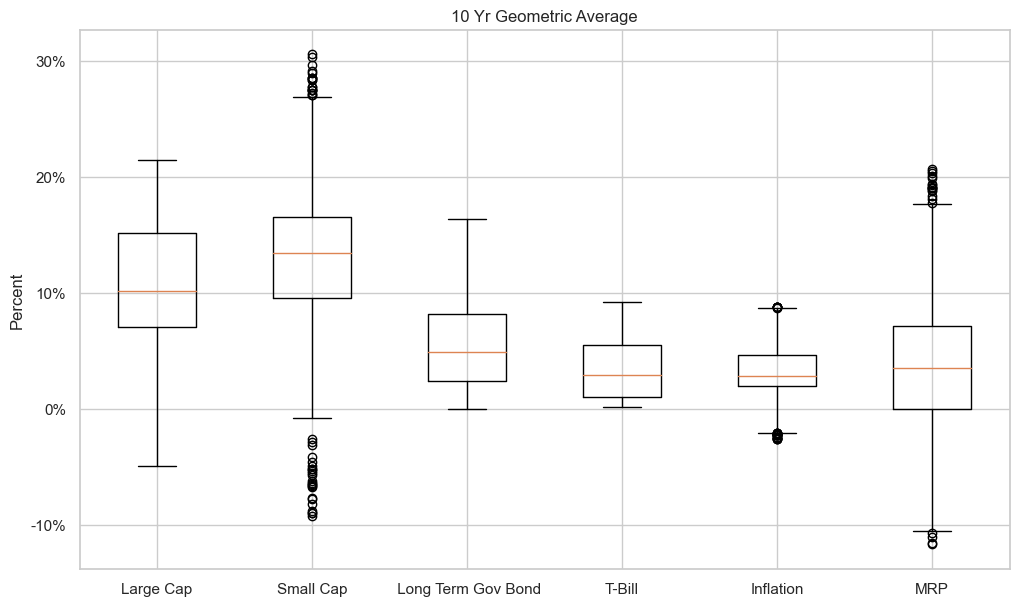
For the 10 Year window, we see some relatively large dispersion especially related to small cap returns. It is unlikely that returns will be below 0 for any given asset class. The historical 5th and 95th percentiles give a good idea of our likely, best and worst cases, but not what happens in the tails.
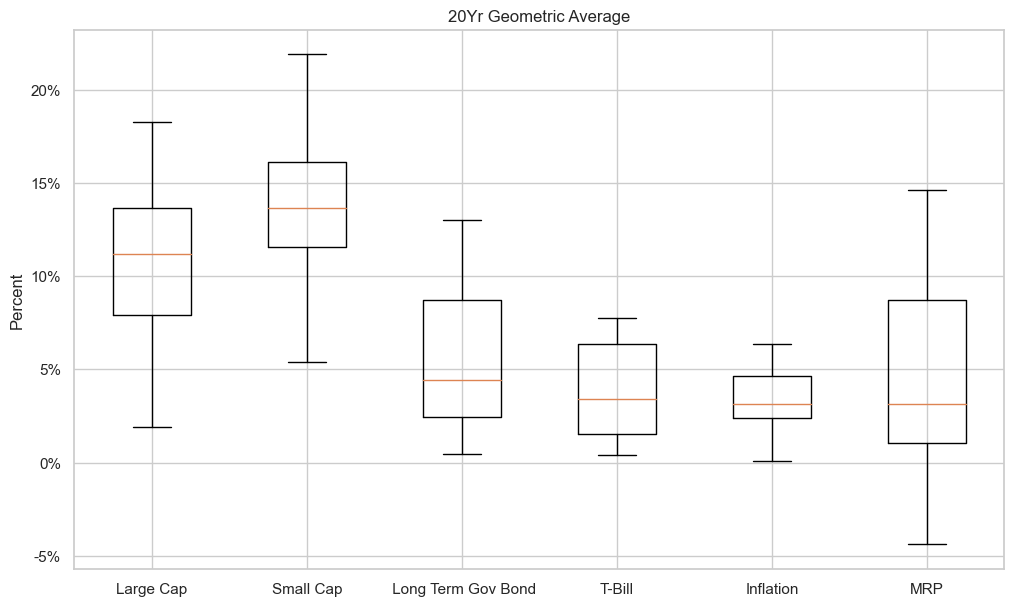
For the 20 year window, we still see dispersion, but much less than in the 10 year window. If we have a 20 year horizon, and the past is any indication of future results, than we should be confident that our equity returns will be a) positive, and b) somewhere between ~6% and ~ 16% annualized.
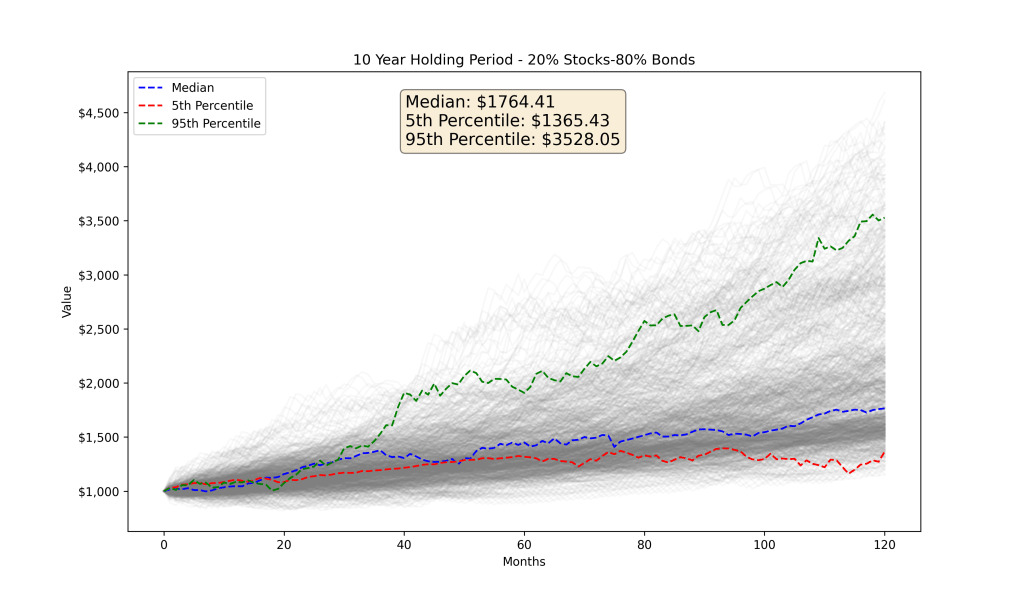

| Stock/Bond Allocation | Lower 5% | Upper 95% | Median |
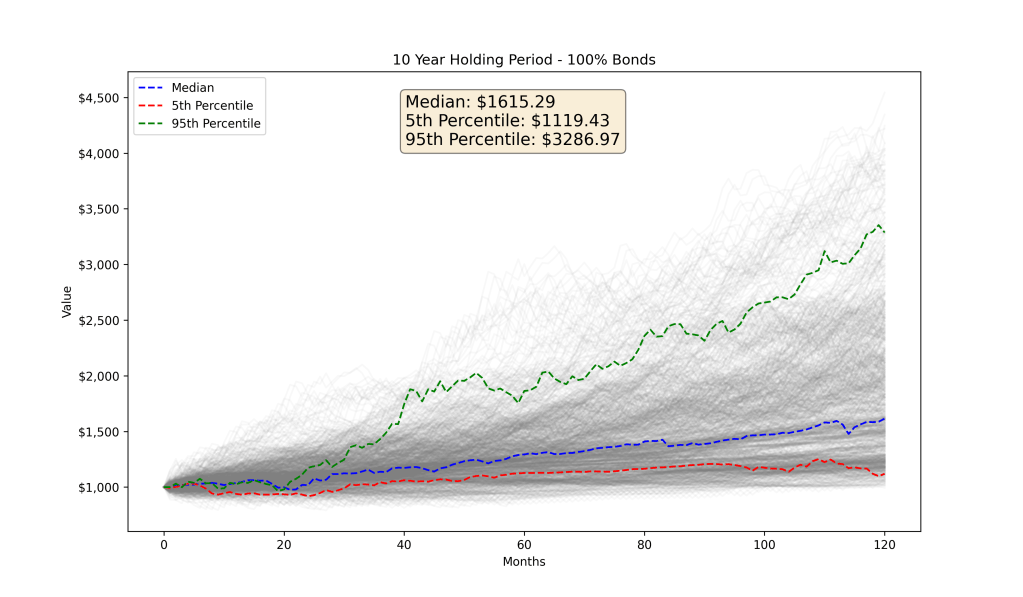
| 0/100 | $1,119 | $3,286 | $1,615 |
| 20/80 | $1,365 | $3,528 | $1,764 |
| 40/60 | $1,479 | $3,825 | $2,097 |
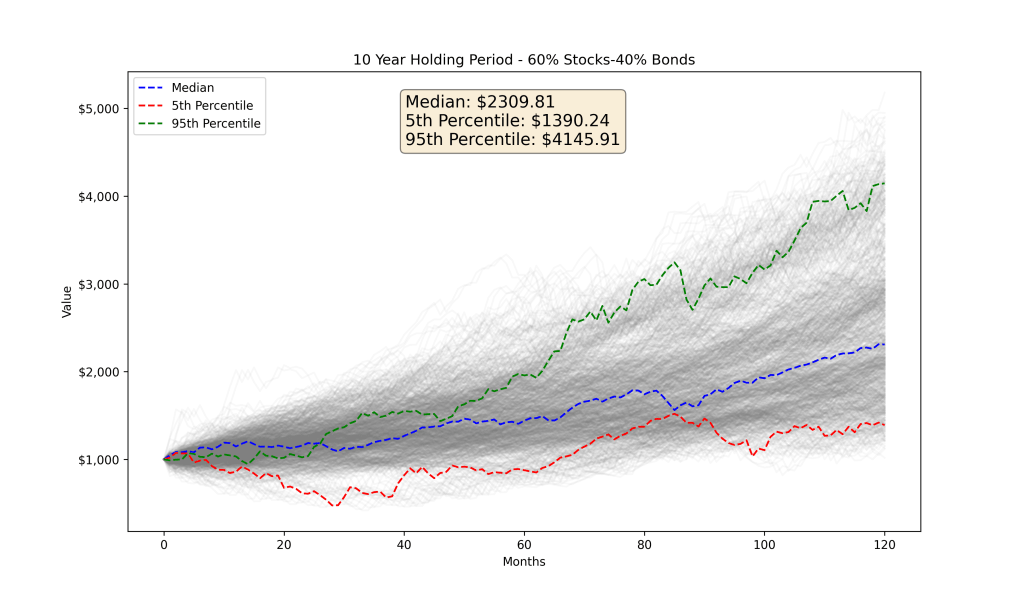
| 60/40 | $1,390 | $4,145 | $2,310 |
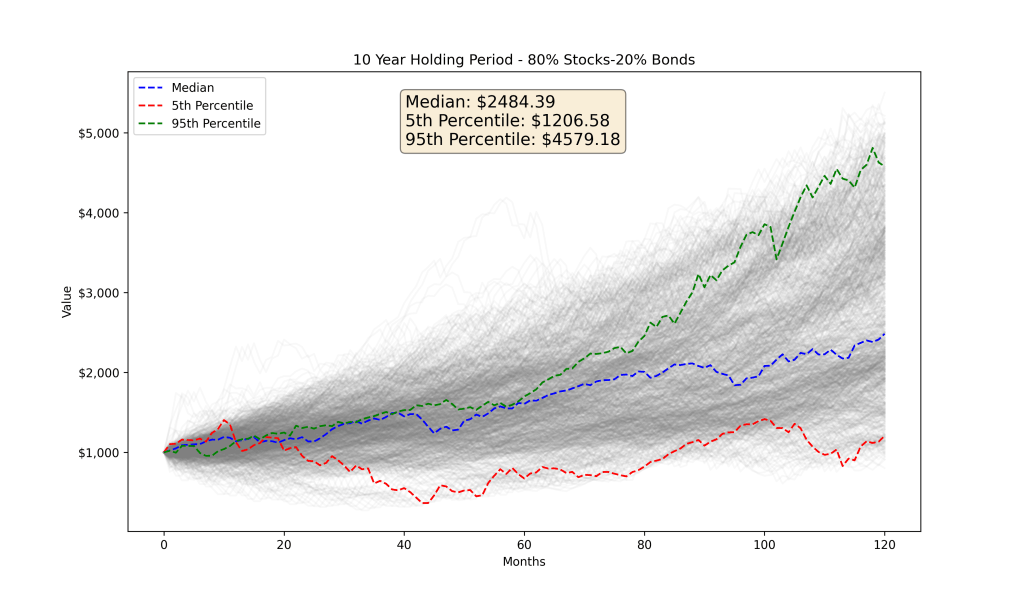
| 80/20 | $1,206 | $4,579 | $2,484 |
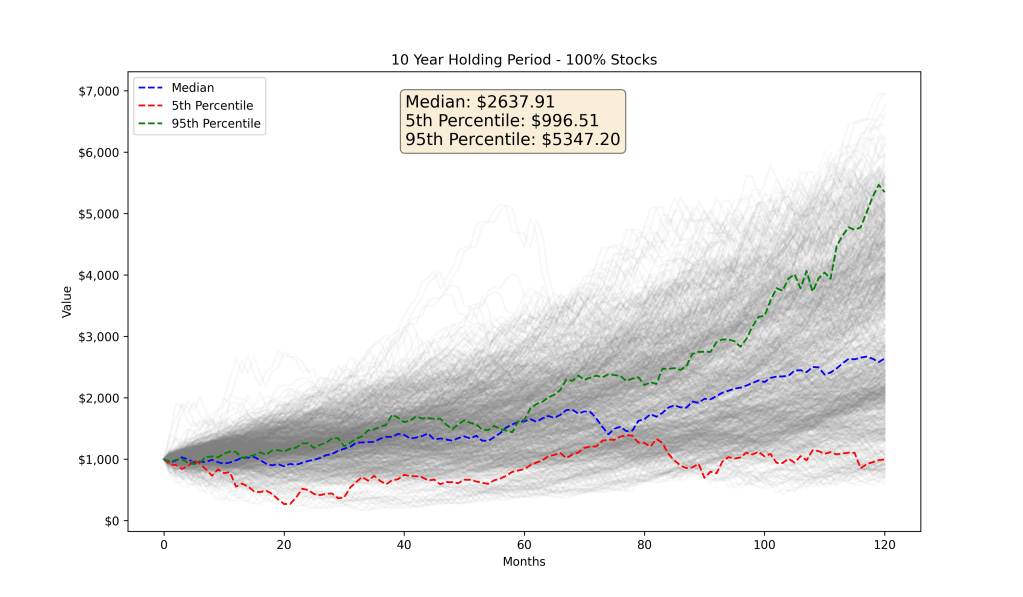
| 100/0 | $997 | $5,347 | $2,637 |
The above table and accompanying graphs, depict median, 5%, and 95% intervals, of the rolling 10 year window ending balances for an initial investment of $1,000.00 from the periods of 1926 through 2022. As you would expect, on average the more equity allocation the larger the terminal balance, however we do see the risks in the all stock portfolio if we look at the 5th percentile, the all stock portfolio ends with less than the initial $1,000.00 investment, while the 5th percentile bond return still ends with a positive 10 year total return of ~ 12%. This is primarily because the returns are more dispersed compared to the fixed income portfolios. However, the high end of the all equity portfolio is over 5x the initial investment!
Conclusions
- Equities are a longer term investment than bonds, given they have no maturity.
- Equities have higher 10 year returns on average for the periods between 1926 and 2022.
- Equities have more downside and wider dispersion of 10 year and 20 year returns relative to bonds.
- The longer the time horizon, the returns in both asset classes are less dispersed.
- The market risk premium on average is somewhere between 4% and 6% depending on the time period measured (this is a good barometer when attempting to forecast forward looking returns)
- If your time horizon is 20 + years, it is fairly safe to have a relatively high equity allocation (> 70%)

Leave a comment