
What are some good ways to construct portfolios? That is the question I am going to tackle today. The answer is never simple and with thousands of different investment choices the question can be daunting. Bogleheads and others will say to set a three fund portfolio, some RIA’s will tell you to invest in a 60/40 portfolio or “rule of thumb” age – bonds. These are all answers, but are they good? How do we know? In this case, the answers above are both simple and work, but by adding a little more complexity, we can build better portfolios on a risk adjusted basis, ex ante.
Risk Parity targets equal risk contribution from each asset in the portfolio. Typically these portfolios will target broad asset class exposure, as opposed to individual stocks. Something like, large cap, long term corporate, long term government, small cap, gold, inflation, oil, emerging markets, etc. Then, by combining the weights in such a way that the risk is equally weighted across assets, the performance of the portfolio will improve providing a higher Sharpe ratio, lower drawdown, and lower volatility.
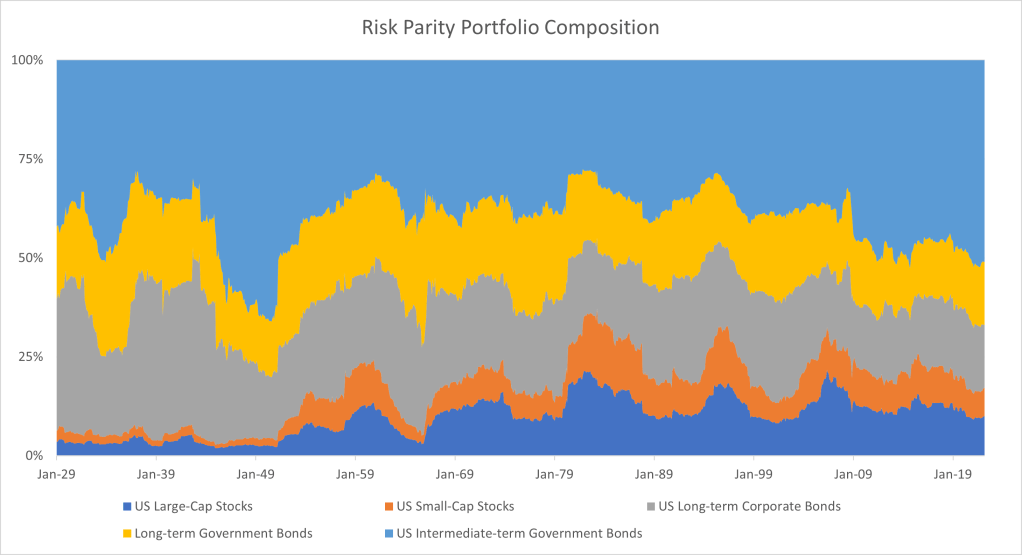
The above chart shows the weights of a 5 asset Risk Parity portfolio using a trailing 36 month standard deviation as a measurement of risk from 1929 through 2022. In the above horserace, the unlevered Risk Parity portfolio is in green. The assets in the portfolio are US Large-Cap Stocks, US Small-Cap Stocks, US Long-term (20-Year) Corporate Bonds, US Long-term (20-Year) Government Bonds, and US Intermediate-term (5-Year) Government Bonds. The composition fluctuates over the years as the relative risk of each of the 5 asset classes changes. Generally speaking, the assets that are riskier have less of a weight in the portfolio, which is why you seem the portfolio dominated by bonds.
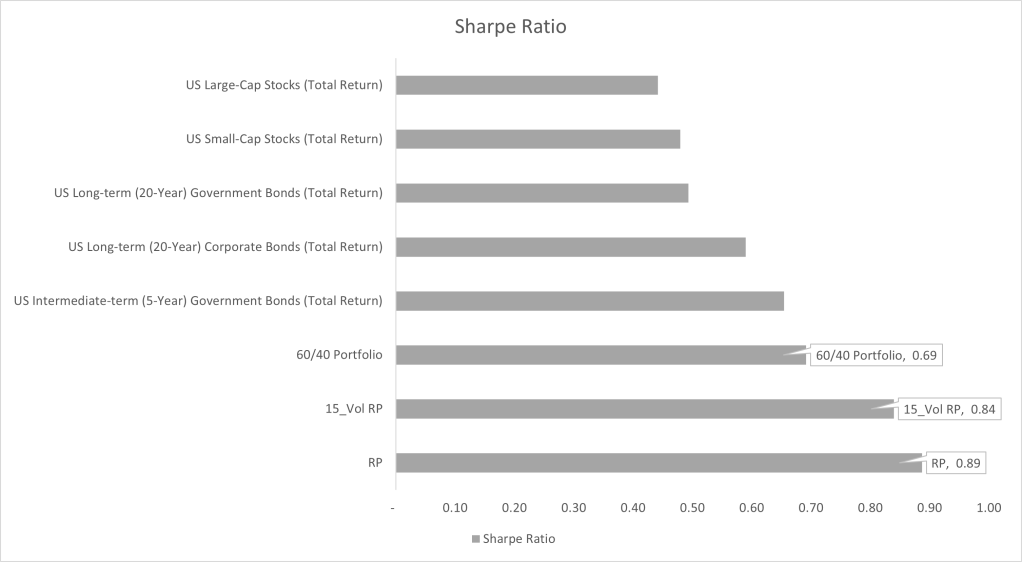
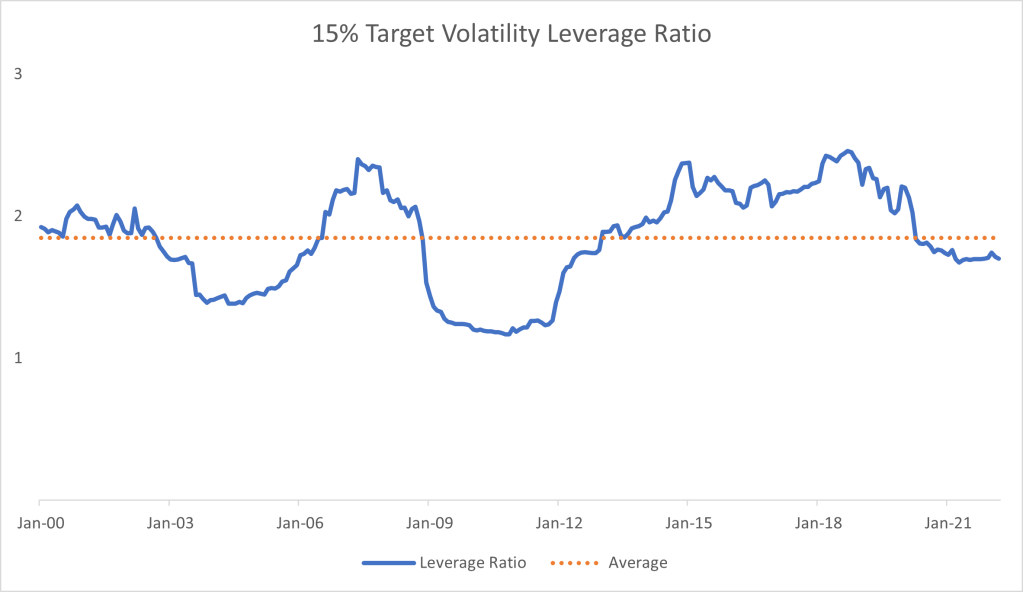
Risk Parity tends to perform better than some of the other common types of investments (For example, in the gallery below, Sharpe ratio of .89 for an unlevered Risk Parity portfolio and .69 Sharpe ratio for the 60/40 bond portfolio). An average leverage ratio for a target 15% volatility Sharpe portfolio is on average around 2X using the 5 assets above from the years 2000 through 2022.
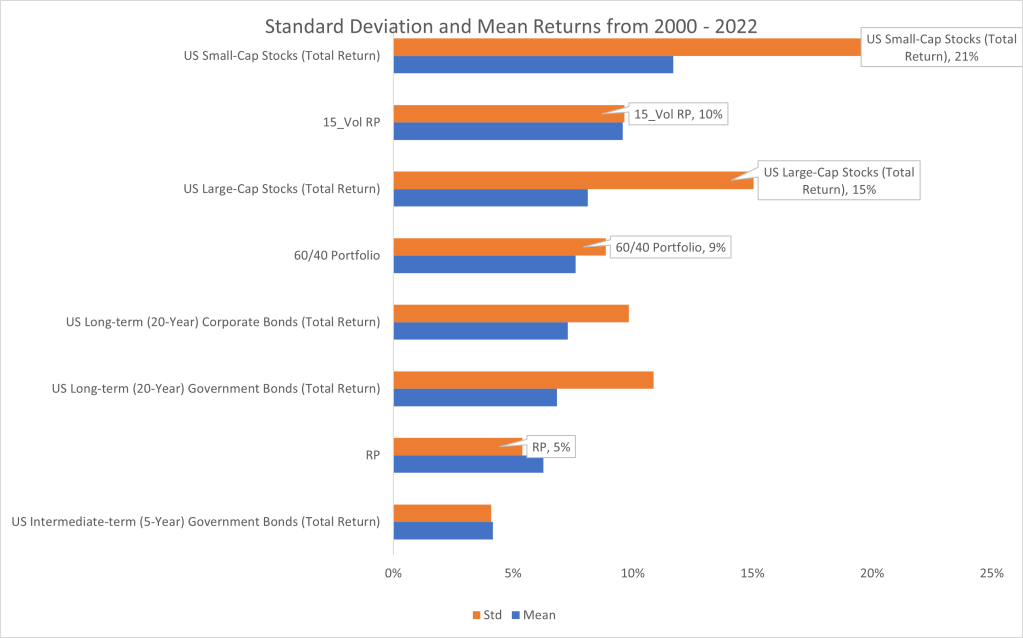
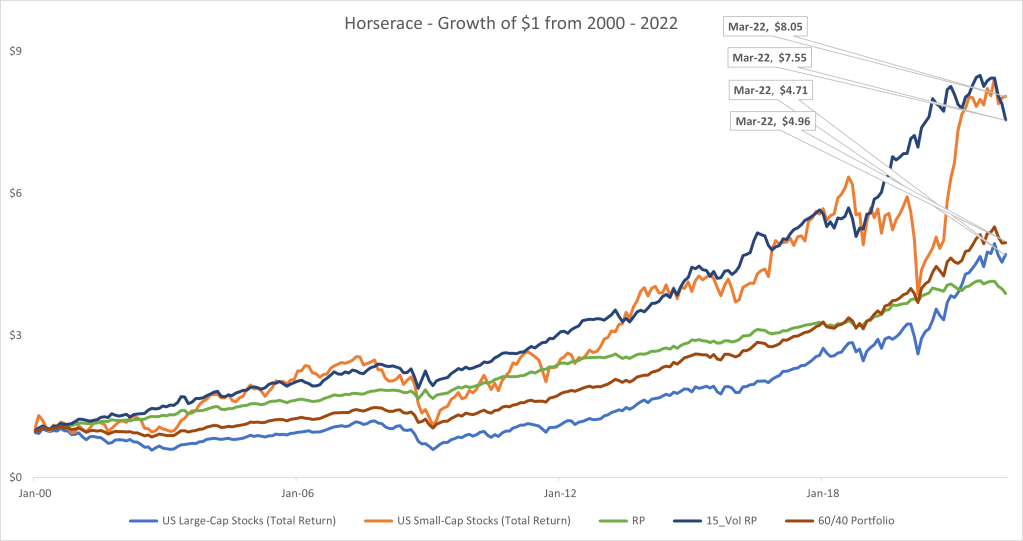
One common critique of Risk Parity is that it has relatively low returns, which makes sense because it is dominated by bonds. For instance, if you have a required return of 10%, it may not help you to have a high Sharpe portfolio that only returns 5%. So we employ leverage to match a target volatility. In practice there are many ways to do this, you can use futures contracts, levered ETF’s, or margin. For the sake of the example, I have used the 30 day t-bill as a proxy for the risk free rate and either earned or charged the value against the levered or unlevered amount (e.g. if the portfolio is not fully invested due to heavy market volatility the cash is assumed to earn the risk free rate). In this 20 year sample the 15% volatility targeted Risk Parity portfolio performs almost on par with the small cap portfolio in terms of gross returns, and dominates the other large cap equity, and 60/40 portfolios, turning $1 into $7.55 during this time period. Additionally, the portfolio dominates the other portfolios with respect to Sharpe Ratio.
Another common critique is that Risk Parity returns have benefited from a secular decline in interest rates over the past ~40 years or so. This is true, however the goal of risk parity is to diversify across several asset classes and when done right, there are diversification benefits that mute things like rising interest rates. For instance, if commodities or TIPS are an asset class they will benefit from rising inflation which tend to accompany rising interest rates, or if rates are rising to reflect a growth economy then exposure to equities will increase in value.
You may be wondering why the Risk Parity portfolio with a 15% target volatility actually realizes less than a 15% volatility in practice. The answer is in the construction of Risk Parity. Risk Parity doesn’t estimate correlations, it just estimates volatility. In practice, there is a diversification benefit to combining less correlated assets. That benefit is ~ 5% in the 20 year sample above.
Conclusions:
Generally speaking, a combination of lower risk assets with higher risk assets diversify your returns and improve Sharpe ratios.
A little leverage can go a long way if you have a low risk strategy.

Leave a comment